a synuclein Search Results


90
Proteintech peptide
Peptide, supplied by Proteintech, used in various techniques. Bioz Stars score: 90/100, based on 1 PubMed citations. ZERO BIAS - scores, article reviews, protocol conditions and more
https://www.bioz.com/product/a+synuclein/a-Synuclein+Fusion+Protein/pm30521933-131-11-12
Average 90 stars, based on 1 article reviews
peptide - by Bioz Stars, 2026-09
90/100 stars
  Buy from Supplier

95
StressMarq fibrils
Fibrils, supplied by StressMarq, used in various techniques. Bioz Stars score: 95/100, based on 1 PubMed citations. ZERO BIAS - scores, article reviews, protocol conditions and more
https://www.bioz.com/product/a+synuclein/Alpha+Synuclein+Protein/pmc10651132-153-22-23
Average 95 stars, based on 1 article reviews
fibrils - by Bioz Stars, 2026-09
95/100 stars
  Buy from Supplier

92
StressMarq against α syn pser129
Against α Syn Pser129, supplied by StressMarq, used in various techniques. Bioz Stars score: 92/100, based on 1 PubMed citations. ZERO BIAS - scores, article reviews, protocol conditions and more
https://www.bioz.com/product/a+synuclein/Anti-Alpha+Synuclein+Antibody/us11098108-425-45-44
Average 92 stars, based on 1 article reviews
against α syn pser129 - by Bioz Stars, 2026-09
92/100 stars
  Buy from Supplier

93
StressMarq α syn pff
α Syn Pff, supplied by StressMarq, used in various techniques. Bioz Stars score: 93/100, based on 1 PubMed citations. ZERO BIAS - scores, article reviews, protocol conditions and more
https://www.bioz.com/product/a+synuclein/Alpha+Synuclein+Protein/bio_rxiv__2023__11__06__565731-81-5-7
Average 93 stars, based on 1 article reviews
α syn pff - by Bioz Stars, 2026-09
93/100 stars
  Buy from Supplier

94
StressMarq α syn monomer
α Syn Monomer, supplied by StressMarq, used in various techniques. Bioz Stars score: 94/100, based on 1 PubMed citations. ZERO BIAS - scores, article reviews, protocol conditions and more
https://www.bioz.com/product/a+synuclein/Alpha+Synuclein+Protein/bio_rxiv__2023__06__27__546642-120-18-23
Average 94 stars, based on 1 article reviews
α syn monomer - by Bioz Stars, 2026-09
94/100 stars
  Buy from Supplier

90
Boster Bio synapsin
Synapsin, supplied by Boster Bio, used in various techniques. Bioz Stars score: 90/100, based on 1 PubMed citations. ZERO BIAS - scores, article reviews, protocol conditions and more
https://www.bioz.com/product/a+synuclein/Anti-Phospho-Alpha+Synuclein+(Ser129)+SNCA+Antibody/pm23346371-109-34-40
Average 90 stars, based on 1 article reviews
synapsin - by Bioz Stars, 2026-09
90/100 stars
  Buy from Supplier

93
StressMarq phosphorylated alpha synuclein s129 pasyn s129
A. Representative images of the GFAP (1:1000)- stained astrocytes and aSynuclein (1:200). B. Histogram of the percentage of GFAP-positive cells’ quantification. C. Histogram of GFAP fluorescence intensity quantification. D. Histogram of GFAP cell area quantification. E. Histogram of aSyn fluorescence intensity quantification. F. Histogram of <t>paSyn</t> <t>S129</t> fluorescence intensity quantification. Images were acquired on a confocal point scanning microscope, (Zeiss LSM 900 with Airyscan 2), with a 20x objective for whole dentate gyrus imaging and a 63x objective for zooming in on the astrocytic cells. The scale bar is 100 µm or 50 µm for stained images. Values are the mean ± SD for n=3-8 for all groups. The symbols denote statistically significant differences inter groups: Ctrl PBS vs IntPb PBS/PerPb PBS; Ctrl aSyn vs IntPb aSyn/PerPb aSyn - *p < 0.05, **p < 0.01, ***p < 0.001, ****p < 0.0001; Ctrl PBS vs IntPb aSyn/PerPb aSyn; Ctrl aSyn vs IntPb PBS/PerPb PBS - # p < 0.05, ## p < 0.01, ### p < 0.001, #### p < 0.0001; Ctrl PBS vs Ctrl aSyn/ IntPb PBS vs IntPb aSyn/ PerPb PBS vs PerPb aSyn - $ p < 0.05, $$ p < 0.01, $$$ p < 0.001, $$$$ p < 0.0001; one-way ANOVA, Tuckey’s multiple comparison test.
Phosphorylated Alpha Synuclein S129 Pasyn S129, supplied by StressMarq, used in various techniques. Bioz Stars score: 93/100, based on 1 PubMed citations. ZERO BIAS - scores, article reviews, protocol conditions and more
https://www.bioz.com/product/a+synuclein/Anti-Alpha+Synuclein+Antibody/bio_rxiv__2024__10__10__617554-163-70-79
Average 93 stars, based on 1 article reviews
phosphorylated alpha synuclein s129 pasyn s129 - by Bioz Stars, 2026-09
93/100 stars
  Buy from Supplier

92
StressMarq monoclonal anti asyn antibody 3c11
A. Representative images of the GFAP (1:1000)- stained astrocytes and aSynuclein (1:200). B. Histogram of the percentage of GFAP-positive cells’ quantification. C. Histogram of GFAP fluorescence intensity quantification. D. Histogram of GFAP cell area quantification. E. Histogram of aSyn fluorescence intensity quantification. F. Histogram of <t>paSyn</t> <t>S129</t> fluorescence intensity quantification. Images were acquired on a confocal point scanning microscope, (Zeiss LSM 900 with Airyscan 2), with a 20x objective for whole dentate gyrus imaging and a 63x objective for zooming in on the astrocytic cells. The scale bar is 100 µm or 50 µm for stained images. Values are the mean ± SD for n=3-8 for all groups. The symbols denote statistically significant differences inter groups: Ctrl PBS vs IntPb PBS/PerPb PBS; Ctrl aSyn vs IntPb aSyn/PerPb aSyn - *p < 0.05, **p < 0.01, ***p < 0.001, ****p < 0.0001; Ctrl PBS vs IntPb aSyn/PerPb aSyn; Ctrl aSyn vs IntPb PBS/PerPb PBS - # p < 0.05, ## p < 0.01, ### p < 0.001, #### p < 0.0001; Ctrl PBS vs Ctrl aSyn/ IntPb PBS vs IntPb aSyn/ PerPb PBS vs PerPb aSyn - $ p < 0.05, $$ p < 0.01, $$$ p < 0.001, $$$$ p < 0.0001; one-way ANOVA, Tuckey’s multiple comparison test.
Monoclonal Anti Asyn Antibody 3c11, supplied by StressMarq, used in various techniques. Bioz Stars score: 92/100, based on 1 PubMed citations. ZERO BIAS - scores, article reviews, protocol conditions and more
https://www.bioz.com/product/a+synuclein/Anti-Alpha+Synuclein+Antibody/bio_rxiv__2023__08__10__552896-178-0-4
Average 92 stars, based on 1 article reviews
monoclonal anti asyn antibody 3c11 - by Bioz Stars, 2026-09
92/100 stars
  Buy from Supplier

93
StressMarq alpha synuclein
A. Representative images of the GFAP (1:1000)- stained astrocytes and aSynuclein (1:200). B. Histogram of the percentage of GFAP-positive cells’ quantification. C. Histogram of GFAP fluorescence intensity quantification. D. Histogram of GFAP cell area quantification. E. Histogram of aSyn fluorescence intensity quantification. F. Histogram of <t>paSyn</t> <t>S129</t> fluorescence intensity quantification. Images were acquired on a confocal point scanning microscope, (Zeiss LSM 900 with Airyscan 2), with a 20x objective for whole dentate gyrus imaging and a 63x objective for zooming in on the astrocytic cells. The scale bar is 100 µm or 50 µm for stained images. Values are the mean ± SD for n=3-8 for all groups. The symbols denote statistically significant differences inter groups: Ctrl PBS vs IntPb PBS/PerPb PBS; Ctrl aSyn vs IntPb aSyn/PerPb aSyn - *p < 0.05, **p < 0.01, ***p < 0.001, ****p < 0.0001; Ctrl PBS vs IntPb aSyn/PerPb aSyn; Ctrl aSyn vs IntPb PBS/PerPb PBS - # p < 0.05, ## p < 0.01, ### p < 0.001, #### p < 0.0001; Ctrl PBS vs Ctrl aSyn/ IntPb PBS vs IntPb aSyn/ PerPb PBS vs PerPb aSyn - $ p < 0.05, $$ p < 0.01, $$$ p < 0.001, $$$$ p < 0.0001; one-way ANOVA, Tuckey’s multiple comparison test.
Alpha Synuclein, supplied by StressMarq, used in various techniques. Bioz Stars score: 93/100, based on 1 PubMed citations. ZERO BIAS - scores, article reviews, protocol conditions and more
https://www.bioz.com/product/a+synuclein/Alpha+Synuclein+Antibody/ppr0654724-72-6-9
Average 93 stars, based on 1 article reviews
alpha synuclein - by Bioz Stars, 2026-09
93/100 stars
  Buy from Supplier

93
StressMarq α synuclein fibrils
A. Representative images of the GFAP (1:1000)- stained astrocytes and aSynuclein (1:200). B. Histogram of the percentage of GFAP-positive cells’ quantification. C. Histogram of GFAP fluorescence intensity quantification. D. Histogram of GFAP cell area quantification. E. Histogram of aSyn fluorescence intensity quantification. F. Histogram of <t>paSyn</t> <t>S129</t> fluorescence intensity quantification. Images were acquired on a confocal point scanning microscope, (Zeiss LSM 900 with Airyscan 2), with a 20x objective for whole dentate gyrus imaging and a 63x objective for zooming in on the astrocytic cells. The scale bar is 100 µm or 50 µm for stained images. Values are the mean ± SD for n=3-8 for all groups. The symbols denote statistically significant differences inter groups: Ctrl PBS vs IntPb PBS/PerPb PBS; Ctrl aSyn vs IntPb aSyn/PerPb aSyn - *p < 0.05, **p < 0.01, ***p < 0.001, ****p < 0.0001; Ctrl PBS vs IntPb aSyn/PerPb aSyn; Ctrl aSyn vs IntPb PBS/PerPb PBS - # p < 0.05, ## p < 0.01, ### p < 0.001, #### p < 0.0001; Ctrl PBS vs Ctrl aSyn/ IntPb PBS vs IntPb aSyn/ PerPb PBS vs PerPb aSyn - $ p < 0.05, $$ p < 0.01, $$$ p < 0.001, $$$$ p < 0.0001; one-way ANOVA, Tuckey’s multiple comparison test.
α Synuclein Fibrils, supplied by StressMarq, used in various techniques. Bioz Stars score: 93/100, based on 1 PubMed citations. ZERO BIAS - scores, article reviews, protocol conditions and more
https://www.bioz.com/product/a+synuclein/Alpha+Synuclein+Protein/pm37461643-289-34-38
Average 93 stars, based on 1 article reviews
α synuclein fibrils - by Bioz Stars, 2026-09
93/100 stars
  Buy from Supplier

94
StressMarq α syn monomers
A. Representative images of the GFAP (1:1000)- stained astrocytes and aSynuclein (1:200). B. Histogram of the percentage of GFAP-positive cells’ quantification. C. Histogram of GFAP fluorescence intensity quantification. D. Histogram of GFAP cell area quantification. E. Histogram of aSyn fluorescence intensity quantification. F. Histogram of <t>paSyn</t> <t>S129</t> fluorescence intensity quantification. Images were acquired on a confocal point scanning microscope, (Zeiss LSM 900 with Airyscan 2), with a 20x objective for whole dentate gyrus imaging and a 63x objective for zooming in on the astrocytic cells. The scale bar is 100 µm or 50 µm for stained images. Values are the mean ± SD for n=3-8 for all groups. The symbols denote statistically significant differences inter groups: Ctrl PBS vs IntPb PBS/PerPb PBS; Ctrl aSyn vs IntPb aSyn/PerPb aSyn - *p < 0.05, **p < 0.01, ***p < 0.001, ****p < 0.0001; Ctrl PBS vs IntPb aSyn/PerPb aSyn; Ctrl aSyn vs IntPb PBS/PerPb PBS - # p < 0.05, ## p < 0.01, ### p < 0.001, #### p < 0.0001; Ctrl PBS vs Ctrl aSyn/ IntPb PBS vs IntPb aSyn/ PerPb PBS vs PerPb aSyn - $ p < 0.05, $$ p < 0.01, $$$ p < 0.001, $$$$ p < 0.0001; one-way ANOVA, Tuckey’s multiple comparison test.
α Syn Monomers, supplied by StressMarq, used in various techniques. Bioz Stars score: 94/100, based on 1 PubMed citations. ZERO BIAS - scores, article reviews, protocol conditions and more
https://www.bioz.com/product/a+synuclein/Alpha+Synuclein+Protein/10__21203_slash_rs__3__rs___4199316_slash_v1-248-11-14
Average 94 stars, based on 1 article reviews
α syn monomers - by Bioz Stars, 2026-09
94/100 stars
  Buy from Supplier

Image Search Results


A. Representative images of the GFAP (1:1000)- stained astrocytes and aSynuclein (1:200). B. Histogram of the percentage of GFAP-positive cells’ quantification. C. Histogram of GFAP fluorescence intensity quantification. D. Histogram of GFAP cell area quantification. E. Histogram of aSyn fluorescence intensity quantification. F. Histogram of paSyn S129 fluorescence intensity quantification. Images were acquired on a confocal point scanning microscope, (Zeiss LSM 900 with Airyscan 2), with a 20x objective for whole dentate gyrus imaging and a 63x objective for zooming in on the astrocytic cells. The scale bar is 100 µm or 50 µm for stained images. Values are the mean ± SD for n=3-8 for all groups. The symbols denote statistically significant differences inter groups: Ctrl PBS vs IntPb PBS/PerPb PBS; Ctrl aSyn vs IntPb aSyn/PerPb aSyn - *p < 0.05, **p < 0.01, ***p < 0.001, ****p < 0.0001; Ctrl PBS vs IntPb aSyn/PerPb aSyn; Ctrl aSyn vs IntPb PBS/PerPb PBS - # p < 0.05, ## p < 0.01, ### p < 0.001, #### p < 0.0001; Ctrl PBS vs Ctrl aSyn/ IntPb PBS vs IntPb aSyn/ PerPb PBS vs PerPb aSyn - $ p < 0.05, $$ p < 0.01, $$$ p < 0.001, $$$$ p < 0.0001; one-way ANOVA, Tuckey’s multiple comparison test.

Journal: bioRxiv

Article Title: Lead as a toxic environmental toxicant in models of synucleinopathies

doi: 10.1101/2024.10.10.617554

Figure Lengend Snippet: A. Representative images of the GFAP (1:1000)- stained astrocytes and aSynuclein (1:200). B. Histogram of the percentage of GFAP-positive cells’ quantification. C. Histogram of GFAP fluorescence intensity quantification. D. Histogram of GFAP cell area quantification. E. Histogram of aSyn fluorescence intensity quantification. F. Histogram of paSyn S129 fluorescence intensity quantification. Images were acquired on a confocal point scanning microscope, (Zeiss LSM 900 with Airyscan 2), with a 20x objective for whole dentate gyrus imaging and a 63x objective for zooming in on the astrocytic cells. The scale bar is 100 µm or 50 µm for stained images. Values are the mean ± SD for n=3-8 for all groups. The symbols denote statistically significant differences inter groups: Ctrl PBS vs IntPb PBS/PerPb PBS; Ctrl aSyn vs IntPb aSyn/PerPb aSyn - *p < 0.05, **p < 0.01, ***p < 0.001, ****p < 0.0001; Ctrl PBS vs IntPb aSyn/PerPb aSyn; Ctrl aSyn vs IntPb PBS/PerPb PBS - # p < 0.05, ## p < 0.01, ### p < 0.001, #### p < 0.0001; Ctrl PBS vs Ctrl aSyn/ IntPb PBS vs IntPb aSyn/ PerPb PBS vs PerPb aSyn - $ p < 0.05, $$ p < 0.01, $$$ p < 0.001, $$$$ p < 0.0001; one-way ANOVA, Tuckey’s multiple comparison test.

Article Snippet: Succinctly, free-floating sections were washed with TBS 1x (PanReac/AppliChem, Germany), permeabilized with 3% Triton X 100 solution for 15min (Carl Roth, Germany) and blocked with 5% Goat Serum (BioWest, France) and 1% Bovine serum (VWR, USA) for 1 h. The freely floating tissue were then incubated with specific combinations of primary antibodies [astrocytes - glial fibrillary acidic protein - GFAP (chicken, ab4674, abcam, 1:500), alpha synuclein (mouse, 610787, BD Biosciences), phosphorylated alpha synuclein S129 – paSyn S129 (rabbit, SMC-600, StressMarq), Tyrosine Hydroxylase - TH (mouse, MAB5280, Milipore) and Tyrosine Hydroxylase – TH (rabbit, AB152, Milipore)] overnight at 4°C on a shaker.

Techniques: Staining, Fluorescence, Microscopy, Imaging, Comparison
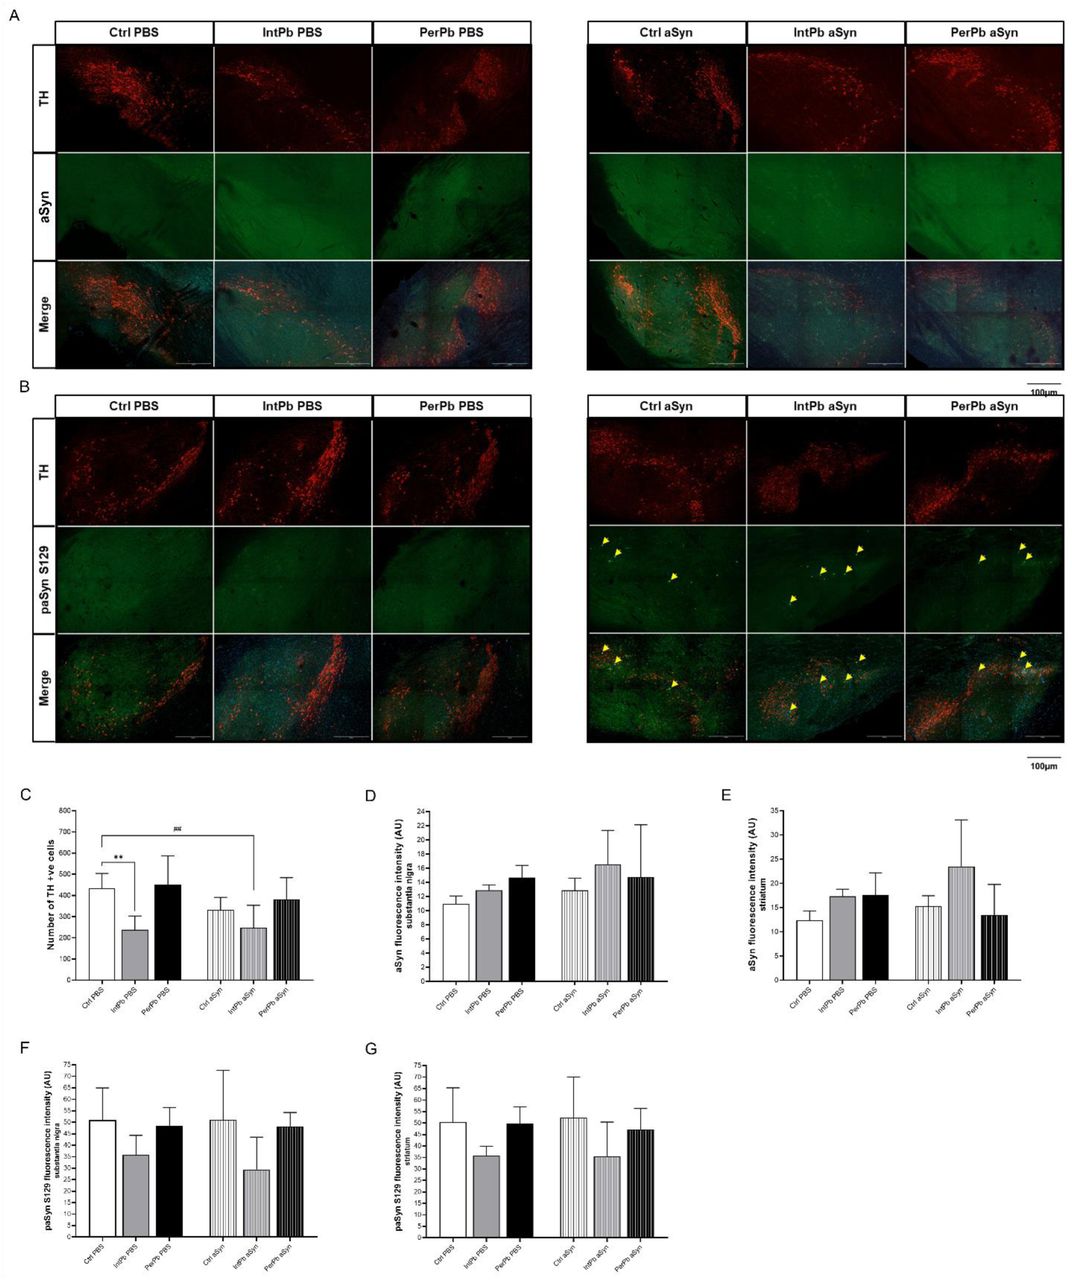
A. Representative images of the TH (1:500)-stained dopaminergic neurons and aSyn (1:200) in the substantia nigra. B. Representative images of the TH (1:500)-stained dopaminergic neurons and paSyn S129 (1:200) in the substantia nigra. C. Histogram of the quantification of TH+ve cells. D. Histogram of quantification of aSyn fluorescence intensity in substantia nigra. E. Histogram of quantification of aSyn fluorescence intensity in striatum. F. Histogram of quantification of paSyn S129 fluorescence intensity in substantia nigra G. Histogram of quantification of paSyn S129 fluorescence intensity in striatum. Images were acquired on a confocal point scanning microscope, (Zeiss LSM 900 with Airyscan 2), with a 10x objective. The scale bar is 100 µm for stained images. Values are the mean ± SD for n=4-8 for all groups. The symbols denote statistically significant differences inter groups: Ctrl PBS vs IntPb PBS/PerPb PBS; Ctrl aSyn vs IntPb aSyn/PerPb aSyn - *p < 0.05, **p < 0.01, ***p < 0.001, ****p < 0.0001; Ctrl PBS vs IntPb aSyn/PerPb aSyn; Ctrl aSyn vs IntPb PBS/PerPb PBS - # p < 0.05, ## p < 0.01, ### p < 0.001, #### p < 0.0001; one-way ANOVA, Tuckey’s multiple comparison test.

Journal: bioRxiv

Article Title: Lead as a toxic environmental toxicant in models of synucleinopathies

doi: 10.1101/2024.10.10.617554

Figure Lengend Snippet: A. Representative images of the TH (1:500)-stained dopaminergic neurons and aSyn (1:200) in the substantia nigra. B. Representative images of the TH (1:500)-stained dopaminergic neurons and paSyn S129 (1:200) in the substantia nigra. C. Histogram of the quantification of TH+ve cells. D. Histogram of quantification of aSyn fluorescence intensity in substantia nigra. E. Histogram of quantification of aSyn fluorescence intensity in striatum. F. Histogram of quantification of paSyn S129 fluorescence intensity in substantia nigra G. Histogram of quantification of paSyn S129 fluorescence intensity in striatum. Images were acquired on a confocal point scanning microscope, (Zeiss LSM 900 with Airyscan 2), with a 10x objective. The scale bar is 100 µm for stained images. Values are the mean ± SD for n=4-8 for all groups. The symbols denote statistically significant differences inter groups: Ctrl PBS vs IntPb PBS/PerPb PBS; Ctrl aSyn vs IntPb aSyn/PerPb aSyn - *p < 0.05, **p < 0.01, ***p < 0.001, ****p < 0.0001; Ctrl PBS vs IntPb aSyn/PerPb aSyn; Ctrl aSyn vs IntPb PBS/PerPb PBS - # p < 0.05, ## p < 0.01, ### p < 0.001, #### p < 0.0001; one-way ANOVA, Tuckey’s multiple comparison test.

Article Snippet: Succinctly, free-floating sections were washed with TBS 1x (PanReac/AppliChem, Germany), permeabilized with 3% Triton X 100 solution for 15min (Carl Roth, Germany) and blocked with 5% Goat Serum (BioWest, France) and 1% Bovine serum (VWR, USA) for 1 h. The freely floating tissue were then incubated with specific combinations of primary antibodies [astrocytes - glial fibrillary acidic protein - GFAP (chicken, ab4674, abcam, 1:500), alpha synuclein (mouse, 610787, BD Biosciences), phosphorylated alpha synuclein S129 – paSyn S129 (rabbit, SMC-600, StressMarq), Tyrosine Hydroxylase - TH (mouse, MAB5280, Milipore) and Tyrosine Hydroxylase – TH (rabbit, AB152, Milipore)] overnight at 4°C on a shaker.

Techniques: Staining, Fluorescence, Microscopy, Comparison